Carbon Footprint
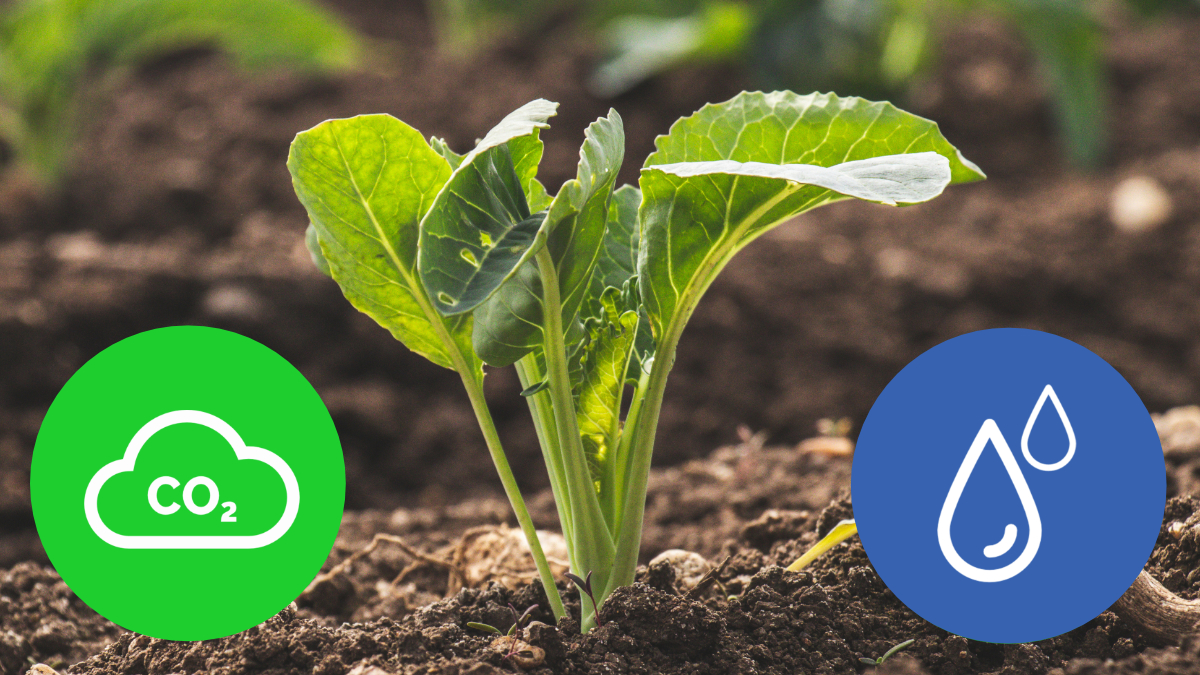
The carbon footprint, also known as the carbon equivalent, is a measure that expresses the total amount of greenhouse gases (especially carbon dioxide – CO2) emitted during the entire life cycle of a product, service, or activity. When focusing on the carbon footprint of food, it includes measuring CO2 emissions and other greenhouse gases that occur at all stages of production, processing, distribution, consumption, and disposal of food.
The carbon footprint of food includes the following life cycle stages:
1) Input raw materials and agricultural production – Includes emissions associated with agricultural production, such as the use of fertilizers, pesticides, fuels, emissions from animal fertilization, and manure storage.
2) Processing and manufacturing – This phase concerns emissions caused by the processing and manufacturing of food, including the energy and fuels used during the production process.
3) Transport and distribution – Includes emissions resulting from the transportation of food from the production site to distribution centers, stores, and consumers. This includes emissions caused by trucks, ships, planes, etc.
4) Consumption and preparation – This phase includes emissions related to the preparation, cooking, cooling, and storage of food by consumers.
5) Waste management – Includes emissions resulting from waste created during the production, distribution, and consumption of food.

The resulting carbon footprint is usually expressed in units of weight of CO2 equivalent (e.g., tons or kilograms of CO2e). Its calculation is addressed by methodologies that attempt to include all the above-mentioned life cycle stages and consider their respective impact on greenhouse gas emissions. Measuring the carbon footprint of food is important for evaluating and comparing the environmental impact of food production.
Water Footprint
The water footprint deals with measuring and evaluating the total amount of water required for growing fruits/vegetables, producing a given product, service, or activity. In the case of drinking water, we can focus on the water footprint associated with products that include non-renewable or degraded drinking water during their life cycle.
Drinking water that is non-renewable or degraded may include water that has been lost or polluted during the production, processing, distribution, or consumption of products. This means that the water footprint focuses on the amount of drinking water that has been consumed or lost due to human activities and inadequate management of this precious resource.
Measuring the water footprint allows us to identify and quantify the consumption of drinking water throughout the product’s life cycle and helps us better understand and address issues related to the scarcity and degradation of drinking water.

Water can be degraded in various ways in connection with growing fruits and vegetables. Here are some ways drinking water can be degraded:
1) Use of chemical fertilizers and pesticides – In crop cultivation, chemical fertilizers and pesticides are often used to improve yields and protect against pests. If these substances are not properly used or disposed of, they can enter the soil and runoff into surface or groundwater, polluting them and reducing their quality.
2) Soil erosion – Improper agricultural practices, such as excessive plowing, pesticide use, or deforestation, can lead to soil erosion. Erosion can cause soil runoff, which can enter water bodies and pollute them.
3) Wastewater from crop processing – During the processing of fruits and vegetables, wastewater containing crop residues, chemicals, and other pollutants is generated. If this wastewater is not properly managed and treated, it can cause pollution of surrounding water sources.
4) Inefficient irrigation – Using inefficient irrigation systems can lead to wasting drinking water. For example, outdated irrigation methods that are not effective in delivering water directly to the plant roots can lead to excessive water consumption and losses due to evaporation.
5) Water contamination from storage and transportation – During the storage and transportation of fruits and vegetables, leaks of chemicals, petroleum substances, or other pollutants can occur, which can contaminate drinking water.
Water resource management, the use of environmentally friendly agricultural practices, efficient irrigation, wastewater recycling, and the implementation of protective measures can contribute to reducing the water footprint of food.
Not All Footprints Are the Same
Water is a fundamental life-giving substance for all forms of life on Earth. Although there is enough freshwater globally, it is not evenly distributed. Today, 663 million people worldwide live without access to clean water, and 70% of all our freshwater consumption is associated with food production, especially for irrigation. In regions where water is scarce, this situation becomes problematic for people and the environment because we consume water from these areas through the products we purchase. Our goal should be to reduce dependence on scarce water by 50%.
Aramark uses a unique way to measure the “water footprint,” the amount of water consumed in the production of individual products. This method is based on two elements. The first is the amount of freshwater (surface and groundwater, excluding rainwater or polluted water) used for the production of a product in a given region. The second is the relative water scarcity in the same area. In this way, we consider the stress of water scarcity in the region as a weighting factor for the amount of freshwater consumed.
The water we consume comes from regions with an average water scarcity index of 0.51, which means that we generally consume water under moderate to high water scarcity. However, the average person lives in an area with a water scarcity index of 0.32. This means that many products are transported from areas with high water scarcity to areas with lower water scarcity.
As an example, consider a tomato. A tomato grown in Spain requires 44 times more water for irrigation than in Switzerland. Because water is scarcer in Spain than in Switzerland, the “water scarcity footprint” of an average Spanish tomato is 2400 times higher than that of an average Swiss tomato.

Each country has its unique list of food products that are typically problematic and contribute most to the national water scarcity footprint. The measurement system used by Aramark provides water scarcity footprints for the menu and its ingredients based on the freshwater consumption footprint of the product in a given region and the water scarcity in the region.
To look at specific examples, consider the Czech Republic and Spain. According to our measurement system data, the water scarcity index for the Czech Republic is 0.22. This is significantly lower than in Spain, where the index is 0.63. This means that if you wanted to grow a tomato in the Czech Republic, it would require less water for irrigation than in Spain, and the “water scarcity footprint” would be lower.


